How to Read Peptide HPLC and Mass Spectrometry Reports
Learn to read peptide HPLC and MS reports, interpret peak areas and charge states, and distinguish chromatographic purity from peptide content.
Start a peptide QC review by matching the sample and batch identifiers to the material received. Then read the HPLC and mass spectrometry reports together: HPLC describes the distribution of detectable chromatographic signals, while MS provides evidence about molecular mass. Neither result, by itself, gives the amount of target peptide in the vial or establishes every structural feature. [1] [7] [9]
This guide explains how to read those reports, check the calculations and identify questions to resolve before using a custom research peptide.
Match the reports to the peptide you ordered
Compare the vial label, certificate of analysis (COA), HPLC report and MS report. Look for a common batch number or a documented link between their sample identifiers. If the laboratory uses different identifiers for different tests, ask how they relate to the delivered batch.
Check the complete sequence version, terminal groups and modifications against the approved order. A report for an unmodified sequence does not establish the identity of an ordered labeled or cyclized version. Record the expected molecular mass and whether the reported value is a neutral mass or an ion mass.
We recommend resolving sample and specification mismatches before interpreting any percentage. A readable chromatogram is useful only when its relationship to the material and the requested structure is clear.
Read the HPLC trace alongside the peak table
On an HPLC chromatogram, the horizontal axis normally shows retention time and the vertical axis shows detector response. Check the detector type, wavelength where applicable, column and method information. Locate the peak assigned to the requested peptide rather than assuming that the tallest peak has the correct identity.
For an area-normalized result, the reported percentage is calculated from integrated peak areas:
Area% = assigned peak area ÷ sum of included peak areas × 100
Peak height and peak area are different measurements. Area% is a signal ratio without response-factor correction; its relationship to component amounts depends on their detector responses. Check which peaks were included in the calculation and how the baseline was integrated. [1]

![[2]](https://alanscientific.oss-us-east-1.aliyuncs.com/67ed3d86e4b04ea5b15cf515.png)
The published Alan Scientific HPLC example lists a minor peak at 7.131 minutes with an area of 14,862 and a total reported area of 7,598,238. Applying the area formula gives 0.1956%, matching that row in the table. This is a calculation for one minor peak, not the product-purity result. It checks the arithmetic, not the identity of that peak. [2]
A large main peak can contain co-eluting components. Published synthetic-peptide analyses show that changing chromatographic conditions can reveal additional peaks or separate species with the same mass. A small peak or shoulder therefore needs analytical context; its position alone does not identify a particular impurity. [3]
We recommend reading the full chromatogram, peak table and method together. A cropped peak image or a single purity number leaves the integration and separation context unclear.
Interpret the MS result using its charge and mass convention
The horizontal axis of a mass spectrum is usually m/z, the mass-to-charge ratio. In electrospray ionization (ESI), a peptide can acquire more than one charge. Consequently, several signals can represent different charge states of the same peptide. Their presence is not, on its own, evidence for several different impurities. [4]
Why a 1500 Da peptide can appear near m/z 751
For a positive ion formed only by adding protons, the relationship is:
m/z = (M + z × mp) ÷ z
Here M is the neutral molecular mass, z is the charge number and mp is the proton mass, approximately 1.007276 Da. For an assumed M of 1500.0000 Da, the doubly protonated ion has m/z 751.0073. This is a calculated example, not experimental data. [5]

First identify whether the report presents raw m/z values or a deconvoluted neutral-mass result. Then compare values calculated on the same basis. Monoisotopic and average masses are different conventions and should not be compared as though they were interchangeable. Ask for the applicable mass tolerance rather than applying a universal pass/fail difference. [4] [5]
Also check the ion label. A sodium adduct, such as [M+Na]+, is interpreted differently from a protonated ion, [M+H]+. Use the assigned ion type when checking the expected value; do not treat every additional signal as a new peptide species. [6]
What a matching mass can establish
A mass match supports the expected molecular composition within the method’s capabilities, but it does not independently prove the full amino acid order. Sequence-specific questions may require suitable fragmentation data or other characterization. [7]
Likewise, replacing an L-residue with its D-form does not change the molecular mass. Research on peptide epimers uses additional separation and structural information to distinguish these species. Routine intact-mass agreement should therefore not be described as proof of stereochemical identity. [8]
Keep HPLC purity separate from peptide content
A chromatographic purity result of 98% does not, by itself, mean that 10 mg of lyophilized powder contains 9.8 mg of the desired peptide. The powder can also contain counterions, water and other material that is not quantified by the reported chromatographic percentage. Peptide content and chromatographic purity answer different questions. [9]
If the experiment depends on an accurately defined amount of peptide, check whether content was measured and how that result is defined. For example, a net peptide-content result may include peptidic impurities. Do not substitute an assumed content value when it was not reported. Our peptide quantity and content guide explains the distinction in more detail. [9]
Compare the documentation with the agreed requirements
Use the specification agreed before synthesis as the basis for review. The following questions help separate an analytical result from an interpretation that still needs confirmation.
| What you see | What to check next |
|---|---|
| A purity percentage without a peak table | Request the supporting chromatogram, integration result and method information. |
| An MS peak that differs from the listed molecular weight | Check charge, adduct assignment and mass convention before concluding that the mass is incorrect. |
| Both HPLC and MS results, but inconsistent sample IDs | Ask the supplier to document their connection to the delivered batch. |
| A mass match, but a concern about residue order or stereochemistry | Clarify which structural question remains and which additional evidence would address it. |
| A required content, counterion or application-specific result is absent | Confirm whether the test was performed, whether it was included in the order and what result is available. |
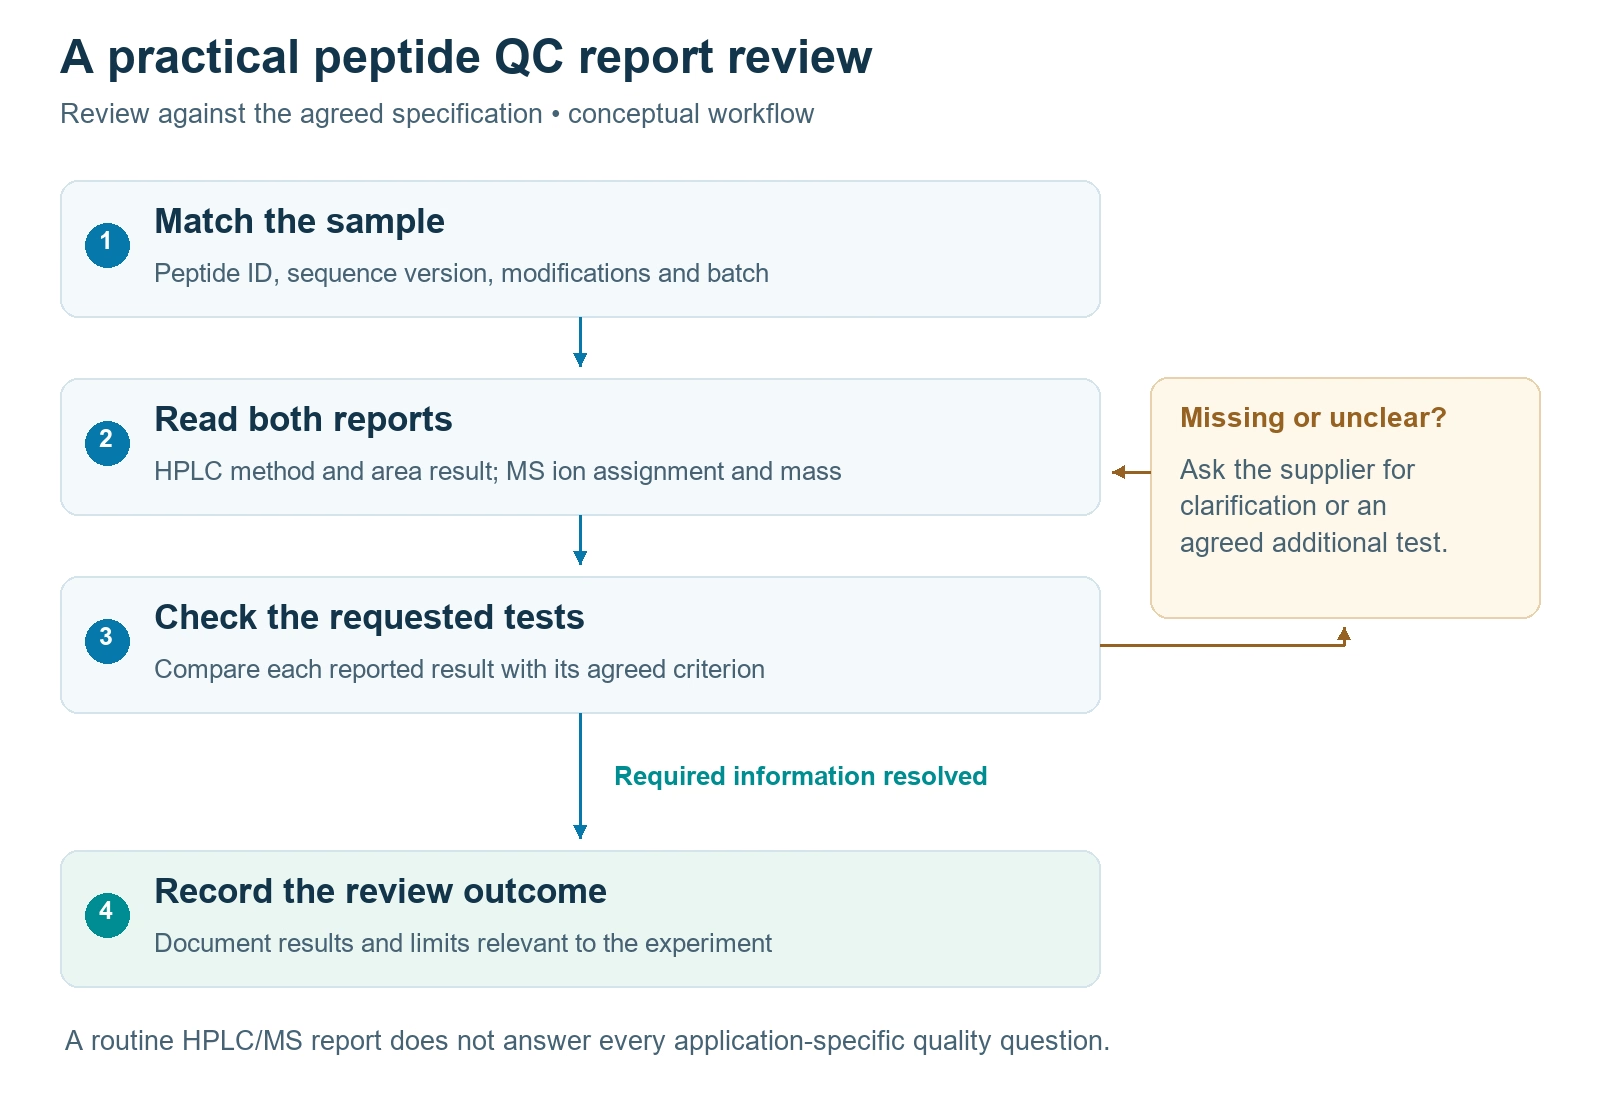
We recommend agreeing any additional analytical requirement before synthesis. State the measurement, reporting units and acceptance criterion where known. If these are undecided, describe the experiment so that the appropriate scope can be reviewed.
Discuss QC requirements for your custom peptide
Alan Scientific supplies custom research peptides as lyophilized powder with paper and electronic QC documentation. Our peptide QC documentation page describes routine and project-specific analytical options.
For a custom peptide synthesis enquiry, send the complete sequence, modifications, quantity and purity requirements, together with any required analytical documentation, to [email protected]. Additional testing and specifications are reviewed for the individual project.
References
Agilent Technologies. Area% and height%. OpenLab CDS Data Analysis documentation.
Alan Scientific. Representative analytical HPLC report: VA-4-Sta, lot P191111-MX054844.
Waters. What are common adducts in ESI mass spectrometry? Knowledge-base article WKB67428.
Lee A. Freedom to Fragment: Introduction. Thermo Fisher Scientific, 2025.